Interpolation techniques
Contents
Interpolation techniques
Nearest Neighbor - Uses the nearest single data point
Linear interpolation - Uses the two closest data points and draws a line between them
Cubic spline - Uses more nearby data points and fits a piecewise cubic polynomial
Linear interpolation
\(\frac{\Delta z}{\Delta x}\) is same between all points
Find the data point \((x,z)\) that falls between \((x_1,z_1)\) and \((x_2,z_2)\). The value \(z\) is unknown, but \(x\) is known and falls between \(x_1\) and \(x_2\).
\(\frac{z - z_1}{x - x_1} = \frac{z_2 - z_1}{x_2 - x_1 }\)
\(z_i = \frac{z_2 - z_1}{x_2 - x_1 }\left(x - x_1\right) + z_1\)
Interpolation in Python
import numpy as np
import matplotlib.pyplot as plt
# From np.interp doc-String
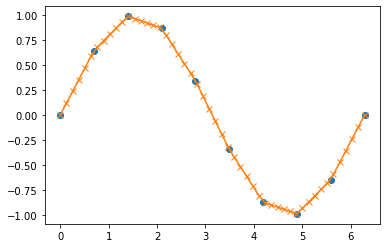
x = np.linspace(0,2*np.pi, 10)
y = np.sin(x)
xvals = np.linspace(0, 2*np.pi, 50)
yinterp = np.interp(xvals, x, y)
fig, ax = plt.subplots()
ax.plot(x,y,'o')
ax.plot(xvals,yinterp,'-x')
[<matplotlib.lines.Line2D at 0x7fa3d9fe6e20>]
from scipy.interpolate import interp1d
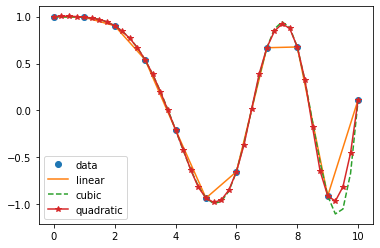
x = np.linspace(0,10,num=11, endpoint=True)
y = np.cos(-x**2/9.0)
f = interp1d(x,y)
f2 = interp1d(x,y, kind='cubic')
f3 = interp1d(x,y, kind='quadratic')
xnew = np.linspace(0,10, num =41, endpoint=True)
fig, ax = plt.subplots()
ax.plot(x,y,'o',xnew, f(xnew), '-', xnew, f2(xnew), '--',xnew,f3(xnew),'*-')
plt.legend(['data','linear','cubic','quadratic'],loc='best',numpoints = 1)
<matplotlib.legend.Legend at 0x7fa3da4d8fd0>
Splines
Originally, mechanical splines where used in boat building to draw a curved line through a set of points
Linear interpolation to design a hull would result in a an ugly inefficient boat design
Splines use data from not only the two nearest points, but also the the two points around the inner two.
“piecewise” fit -different polynomial for each interval between points
line : \( z = ax+b\) (two unkowns)
cubic : \(z = ax^3 + bx^2 +cx +d\) (four unknowns)
Pros
smooth, not jagged: calculate derivatives at data points
Piecewise fit, i.e. the solution at one locations don’t affect the solution far away
Way better than fitting a polynomial to the entire function (ie if you have 8 data point and fit a 9th order polynomial)
Cons
Closely spaced data points lead to “overshooting”
“Smoothing splines” help, but doesn’t represent data exactly